Chapter 6: The Financial Statements
Summary: In the last chapter we learned how to access a company’s financial statements, now let’s review the important parts of each one that will appear in the DCF model. When you have time after this course, we highly recommend diving into the three financial statements and mastering them.
Here is the quiz to skip this section:
Three Financial Statements
All three financial statements are used in the Discounted Cash Flow Model.
The Income Statement
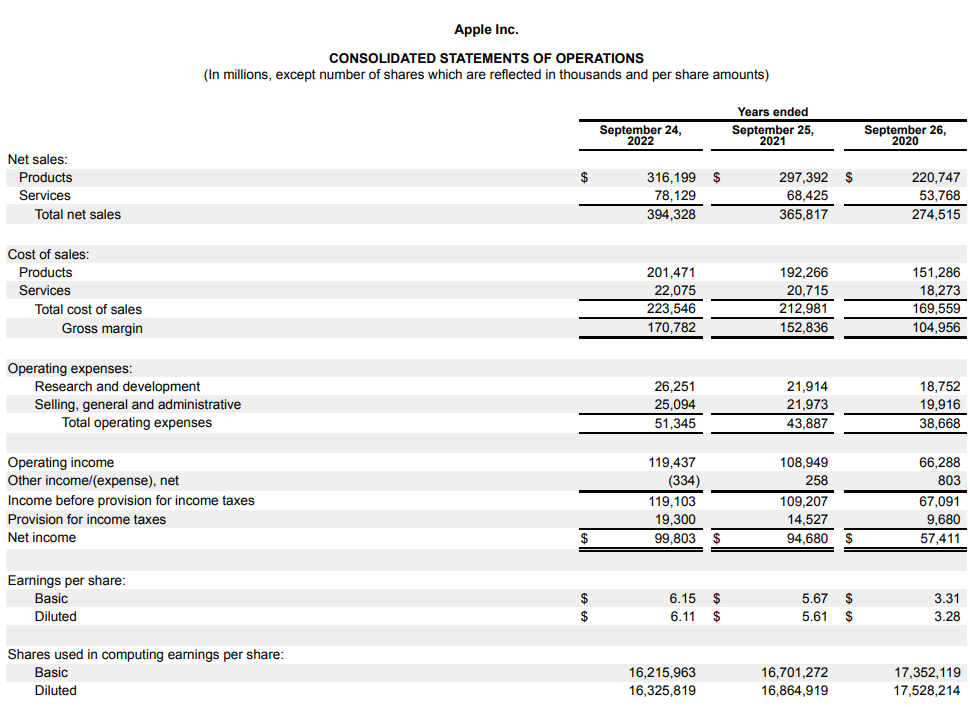
In our opinion, the income statement is the easiest of the financial statements to learn. Let’s continue to use Apple as an example and run through their most recent income statement.
Basics
An income statement calculates how much profit a company made during a specific time period. It does this by adding up every dollar made and spent by the company over a time period of usually a quarter or year.
In Apple’s income statement above, we are looking at annual period, in this case three years. Apple is a little different than most companies, and actually starts their fiscal year in September, compared to many companies who start it on the calendar year system. So, the first column of data is the income statement from September 26, 2021 to September 24, 2022. Note that not all fiscal years are the same number of days.
We almost always abbreviate the name of the time period to the year the fiscal year ends, so the first column is for fiscal year 2022. When you read for example about “Apple’s revenue in 2022”, know that is referring to the time period from Sep 2021 to Sep 2022.
Likewise, Apple’s fiscal year 2021 was from Sep 2020 to Sep 2021. Every company is allowed to choose which date their fiscal year starts on.
Lastly, notice the third line at the top. It is saying that all of the data in the chart is in millions, so if you see the number “1,000”, it actually means 1,000 millions, which is the same as 1 billion.
Revenue
Revenue, also called “sales”, is the total amount of money that Apple collects for selling its products and services. If you buy a MacBook for $1,500 at the Apple Store, that $1,500 is called revenue for Apple.
If we look at the top of the income statement, we notice that Apple calls revenue, “net sales”, which can be used interchangeably with “revenue” and “sales”. For 2022, Apple reported $394,328 in net sales, which is actually $394,328 million, or $394,328,000,000.
Yes that is a massive number. If you assume that Apple only sold MacBooks, and that each MacBook sold for $1,500, that would mean Apple sold 263 million MacBooks.
Open up your model and go to the ‘Discounted Cash Flow Model’ tab. Click on cell “H6” in the model. In the formula bar, you will see the formula ='Business Model'!H16. Switch tabs to the ‘Business Model’ tab and go to that cell, H16. You will see it is pulling directly
Cost of Goods Sold and Gross Margin
Cost of goods sold, also called “cost of sales” or “cost of revenue”, is exactly what the name is: how much it cost the company to make the product it is selling. For the $1,500 MacBook we bought, let’s pretend it cost $500 for the parts and labor to make the laptop. In this case the $500 is the cost of goods sold.
If Apple sells MacBook’s for $1,500 but it only costs $500 to make each one, that means Apple is making $1,000 profit for each MacBook. This $1,000 is called gross margin and is calculated by subtracting cost of goods sold from revenue.
Let’s start populating the DCF model.
In the model you will notice that cells G8 and H8 are empty. Let’s populate it. Flip back to Apple’s 10-K or use the screenshot above to find Apple’s cost of goods sold for 2021 and 2022. While you’re at it, fact that the 2020 cost of goods sold number is correct.
Answers: Cell G8 = $212,981 and Cell H8 = $223,546.
Lastly, double check that the gross margin numbers in cells F10, G10, and H10 match Apple’s income statement. We know that gross margin is revenue minus cost of goods sold so we have a simple subtraction formula in Row 10.
You may be wondering why the rest of row 8 is blank? We will fill in this information in Chapter 9 when we forecast Apple’s expenses and margins.
Operating Expenses
A company’s operating expenses include all other expenses other than cost of goods sold that are needed to operated the business.
Each company has different categories for their operating expenses. Apple groups all of their expenses into two categories:
Research and development.
Selling, general, and administrative.

